Description
CharityML is a fictitious charity organization located in the heart of Silicon Valley that was established to provide financial support for people eager to learn machine learning. After nearly 32,000 letters were sent to people in the community, CharityML determined that every donation they received came from someone that was making more than $50,000 annually.
To expand their potential donor base, CharityML has decided to send letters to residents of California, but to only those most likely to donate to the charity. With nearly 15 million working Californians, CharityML has brought you on board to help build an algorithm to best identify potential donors and reduce overhead cost of sending mail.
Goal:
To evaluate and optimize several different supervised Models to determine which algorithm will provide the highest donation yield while also reducing the total number of letters being sent. Check My - Jupyter notebook.Dataset
The dataset for this project originates from the UCI Machine Learning Repository The datset was donated by Ron Kohavi and Barry Becker, after being published in the article "Scaling Up the Accuracy of Naive-Bayes Classifiers: A Decision-Tree Hybrid". You can find the article by Ron Kohavi online
Data Exploration
A cursory investigation of the dataset will determine how many individuals fit into either group, and the percentage of these individuals making more than $50,000.
Preparing the Data
Before data can be used as input for machine learning algorithms, it often must be cleaned, formatted, and restructured — this is typically known as preprocessing. Fortunately, for this dataset, there are no invalid or missing entries we must deal with, however, there are some qualities about certain features that must be adjusted.
Transforming Skewed Continuous Features
A dataset may sometimes contain at least one feature whose values tend to lie near a single number, but will also have a non-trivial number of vastly larger or smaller values than that single number. Algorithms can be sensitive to such distributions of values and can underperform if the range is not properly normalized. With the census dataset two features fit this description: capital-gain and capital-loss.

Normalizing Numerical Features
In addition to performing transformations on features that are highly skewed, it is often good practice to perform some type of scaling on numerical features. Applying a scaling to the data does not change the shape of each feature's distribution (such as 'capital-gain' or 'capital-loss' above); however, normalization ensures that each feature is treated equally when applying supervised learners.
Data Preprocessing : one-hot encoding
We can see there are several features for each record that are non-numeric. Typically, learning algorithms expect input to be numeric, which requires that non-numeric features (called categorical variables) be converted. One popular way to convert categorical variables is by using the one-hot encoding scheme.
Shuffle and Split Data
Now all categorical variables have been converted into numerical features, and all numerical features have been normalized. As always, we will now split the data (both features and their labels) into training and test sets. 80% of the data will be used for training and 20% for testing.
Supervised Learning Models

Improving Results
Here we will choose from the three supervised learning models the best model to use on the student data. After that we will then perform a grid search optimization for the model over the entire training set (X_train and y_train) by tuning at least one parameter to improve upon the untuned model's F-score.
Choosing the Best Model
Feature Importance
An important task when performing supervised learning on a dataset like the census data we study here is determining which features provide the most predictive power. By focusing on the relationship between only a few crucial features and the target label we simplify our understanding of the phenomenon, which is most always a useful thing to do. In the case of this project, that means we wish to identify a small number of features that most strongly predict whether an individual makes at most or more than $50,000.
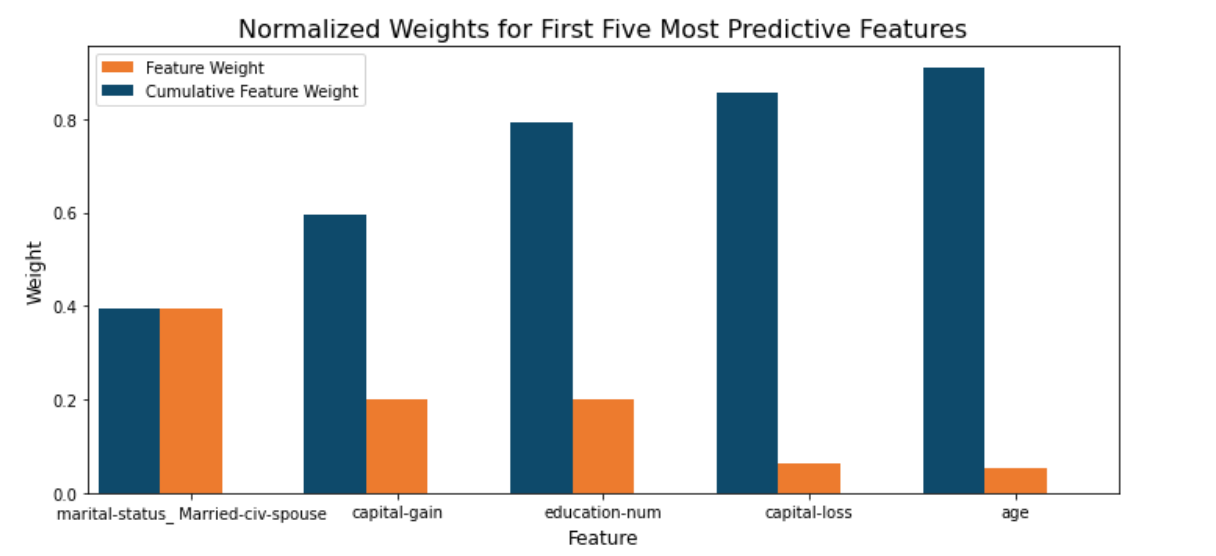
Feature Selection
How does a model perform if we only use a subset of all the available features in the data? With less features required to train, the expectation is that training and prediction time is much lower — at the cost of performance metrics. From the visualization above, we see that the top five most important features contribute more than half of the importance of all features present in the data. This hints that we can attempt to reduce the feature space and simplify the information required for the model to learn. Optimized your model, and train it on the same training set with only the top five important features.
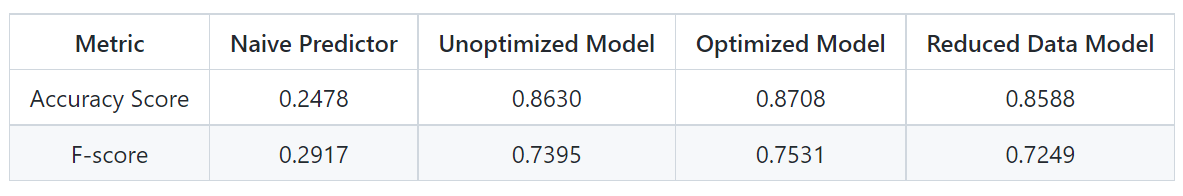
Results